Pages

Thursday, October 31, 2019

Decomposing

Aim: 
To learn about the rate that different materials decompose. 

Hypothesis:
I think that the bananas will rott the fastest.
Materials:

  1.   4x Test Tubes
  2.   Banana
  3.   Bread
  4.   White Styrophone
  5.   Paper
  6.   Bung
  7.   Test Tube Rack
  8. Water
Steps:
  1.   Gather your materials.
  2.  Put the test tubes into the stand.
  3.  Put the banana in test tube one, the bread and water in test tube two, etc.
  4.  Take it back to our table.
  5.  We wrote our names on a piece of paper and taped it to the test tube stand.
  6.  Place the stand onto a surface where it won´t be touched.
  7. Wait five weeks.
Findings:


TODAY
Colour
Change
Observations
Banana
Yellow--
Paper
Brown--
Styrophone cup
White--
Bread
Beige--


3 weeks
Colour
Change
Observations
Banana
Brown and a greenish colourChanged colour and rottedThe banana went from a smallish yellow piece to a brown disgusting smelly mess.
Paper
BrownnothingNothing changed about the paper, it was still brown and it looked the same.
Styrophone cup
whitenothingNothing changed about the styrophone cup, it was still white and it looked the same.
Bread
Green, black and whiteChanged colourThe bread was a normal beige, white colour but it was slowly changing colour to green and black.


5 weeks
Colour
Change
Observations
Banana
GreenChanged fully greenThe banana became completely dark green and covered in mold. 
Paper
brownnothingNothing changed about the paper, it was still brown and it looked the same.
Styrophone cup
WhitenothingNothing changed about the styrophone cup, it was still white and it looked the same.
Bread
white and brownfoam looking white stuff on topThe bread stayed the same colour but has foam looking white stuff over it.


Conclusion:
By the end of this the food was disgusting but it looked like the banana rotted the fastest even though the bread had water in the tube with it. It looked like the banana rotted fastest because by week three it had already started getting mold on it.

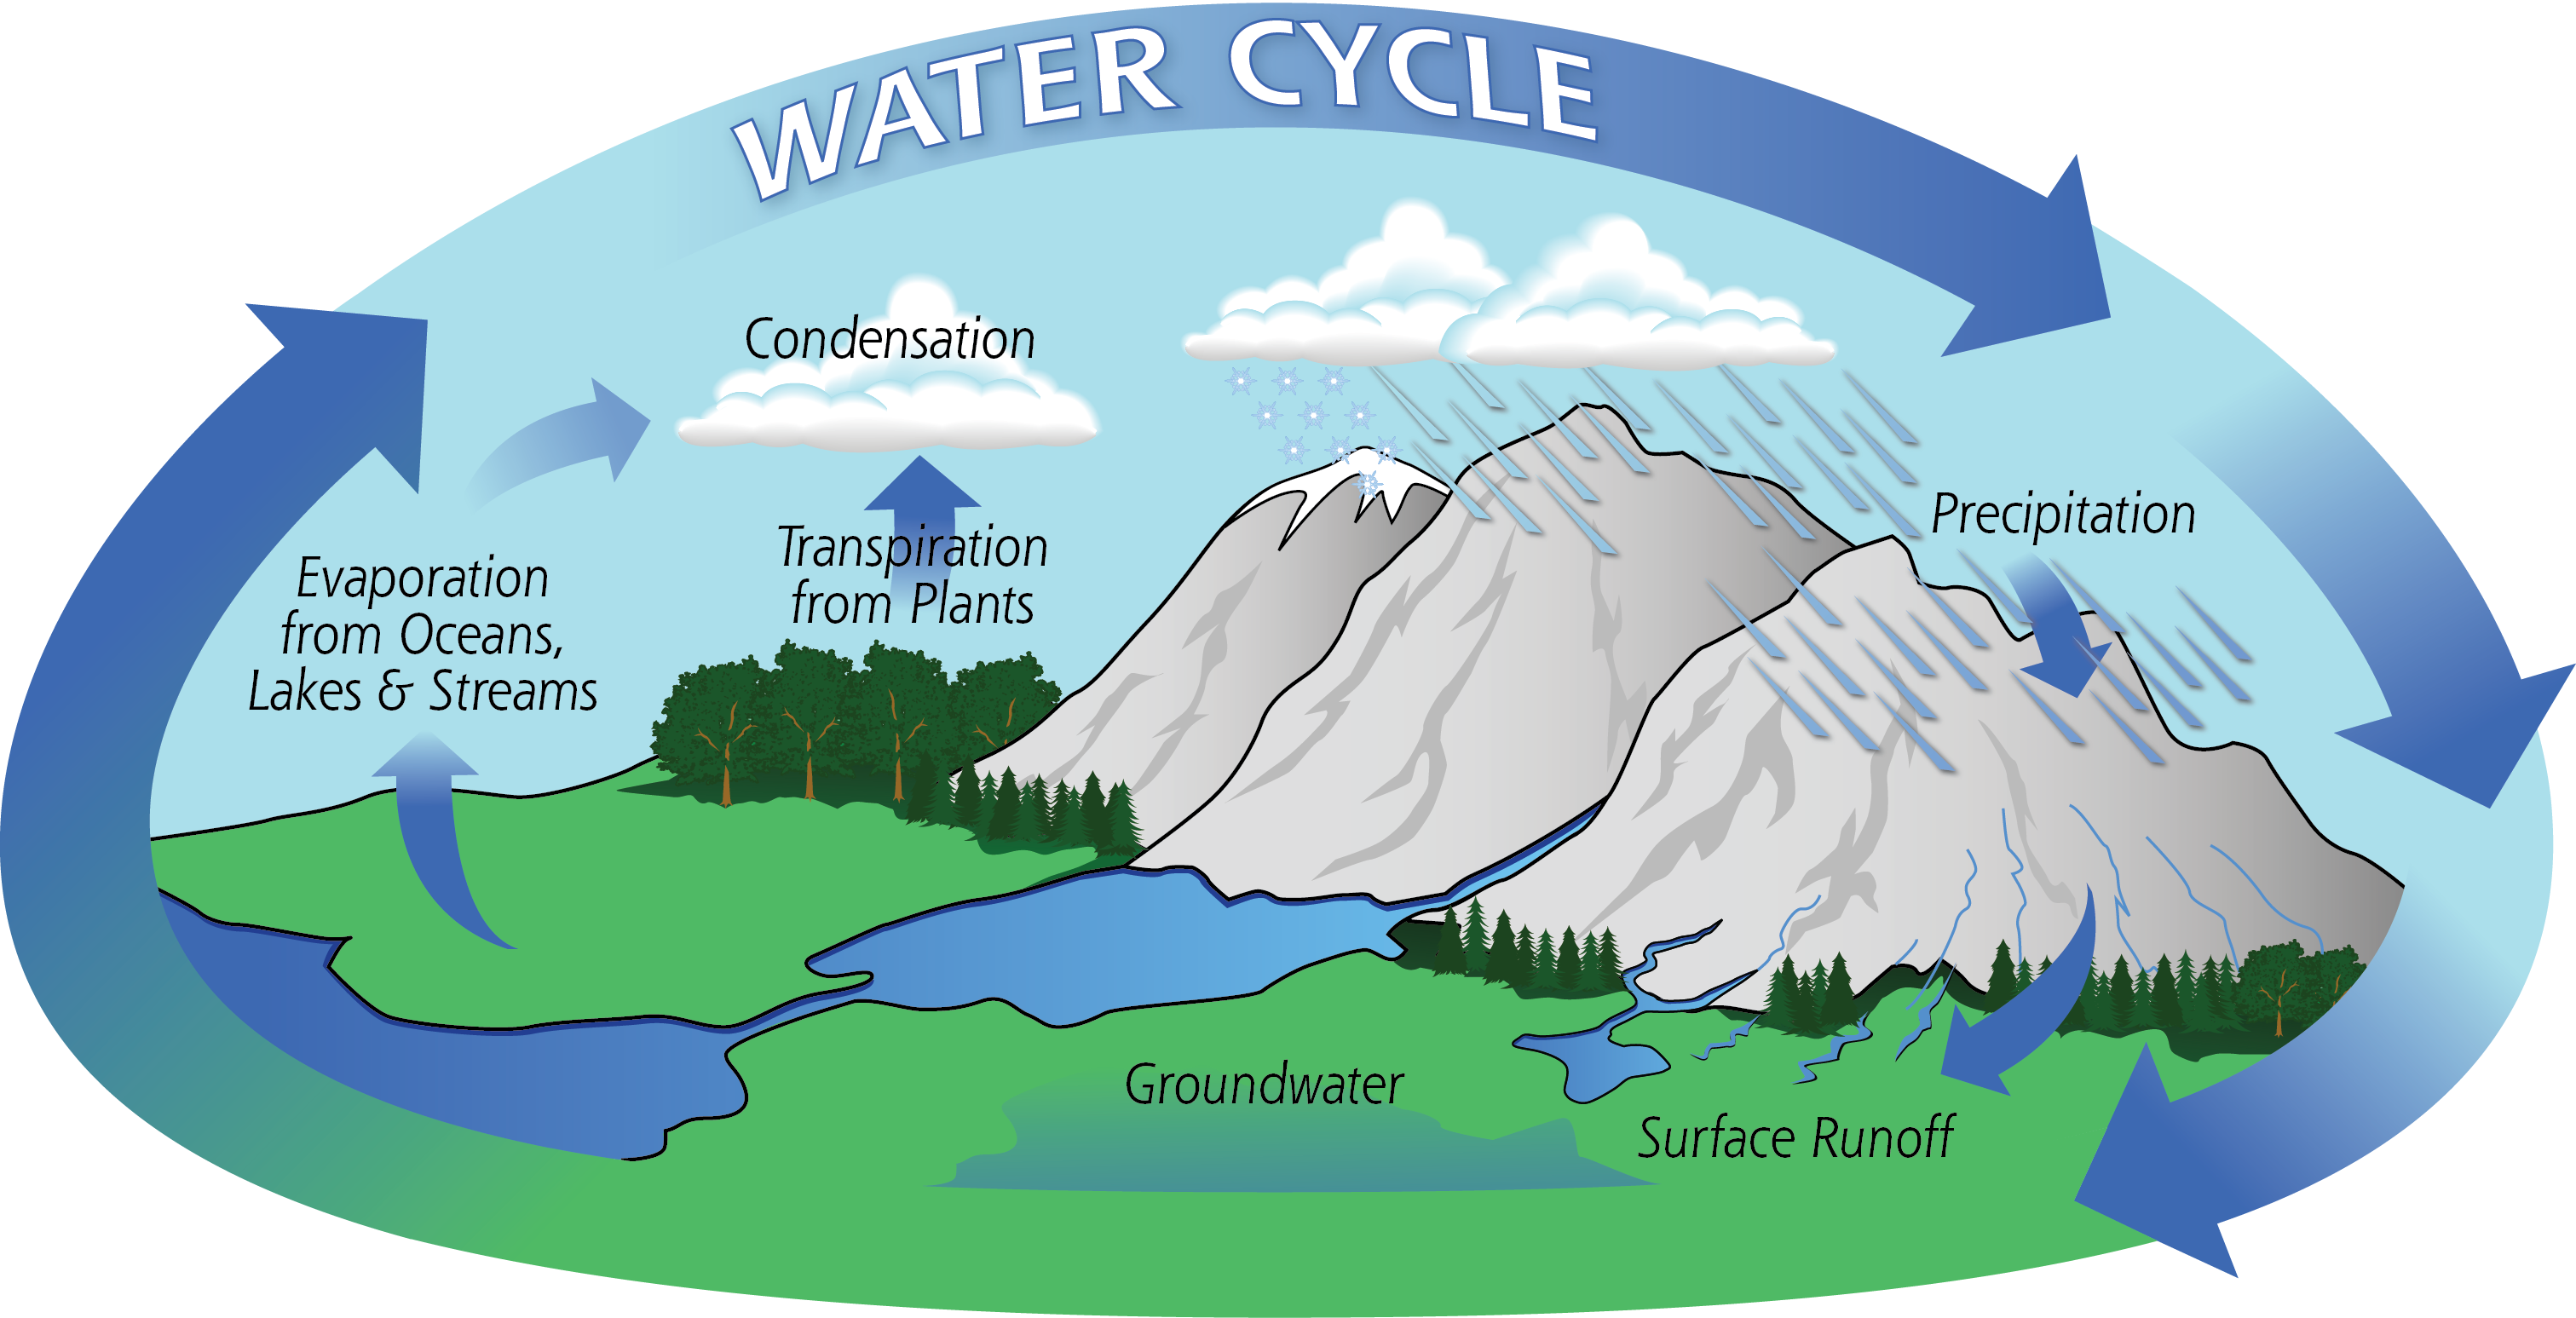
The Water Cycle in a bag ʕ •㉨• ʔ

AIM: TO LEARN ABOUT WATER ON EARTH.

Definition:

Related image

Scientific words:

  • Evaporation. When water is heated by radiant energy it turns into water vapor.
  • Transpiration. Evaporation from plants.
  • Condensation. When water vapor cools, molecules join together and form clouds.
  • Precipitation. When clouds get heavy the waters falls as rain, sleet, hail, or snow.
  • Acidification: the action or process of making or becoming acidic.

THE WATER CYCLE SONG

Image result for the water cycle

THE WATER CYCLE EXPERIMENT

Bag 1: Normal Water cycle
Bag 2: Water cycle with CO2 added: like Oceans in climate change

Material:


  • 2 x A4 clear zip-lock bags.
  • 100m of water.
  • 1 x vivid.
  • Blue food colouring.
  • 100m of soda water.
  • 1 x Litmus paper.
  • 1 x teaspoon of Baking Soda
  • 2 x stripes of double-sided tape.

Steps:

  1. Gather the materials listed above.
  2. Using your vivid draw a picture of the water cycle on the bag.
  3. Add the labels of what the parts of the water cycle are.
  4. Add 100m of water to the bag.
  5. Add 2 drops of blue food colouring to the water.
  6. Zip up the bag.
  7. Tape the bag to a window using double-sided tape.
  8. Get your other bag.
  9. Repeat the drawing steps onbag two.
  10. Add 100m of soda water.
  11. Add one teaspoon of baking soda.
  12. Zip up the bag but leaving a small gap.
  13. Put one strip of litmus paper in leaving it half in the bag and half out.
  14. Make sure the zip lock is closed and securing the paper.
  15. Tape the bag to the window next to bag one using double-sided tape.
  16. Wait for a few days to weeks.
  17. Watch as the condensation builds up.

Findings:


The Water Cycle
Acid Water Cycle
Does it cycle?
YesYes
Amount of Water
11
Acidity
01


Key: Water and acidity amount: 0 = none 
43
1 = small 
2 = large 

Conclusion:

If you follow these steps you will be able to do the experiment successfully and replicate the water cycle process in controlled conditions

The Greenhouse Effect

✧༺♥༻∞The Greenhouse Effect experiment∞༺♥༻✧


AIM: To Look At Climate Change And The Greenhouse Effect.


Materials:

1. 1 x plastic bottle

2.1 x Teaspoon Baking Soda and Citric Acid
3. 1 x heat lamp
4 1 x Thermometer
5. 100ml of water
6. 1 x rubber bung


Procedure:

1. . Collect 2 bottles, 2 lamps and 2 thermometers from the teacher.
2. Set up bottles and lamps beside a PowerPoint on a flat surface.
3. Pour 100ml water and baking soda.
4. Start to record your findings taken from bottle thermometer. These must be every 5 minutes.

Findings: 

Minutes
Bottle 1: Water 
Bottle 2: CO2 Gas
02121
52518
102722
153125
203425
253428
303630
35DNFDNF
40

45

50


The Water Cycle

This week for Climate Chaos we had to cut out 10 hexagons and explain how each of them went together.

Water Cycle is connected to Transpiration because transpiration is a step of the Water Cycle.

Transpiration and Water Vapour are connected because they are all the action of water vapour going up.

Water Vapour and Evaporation are connected together because they are from water (Oceans, Lakes, Rivers, Ponds) and the watering plants.

Water Vapour and Condensation are connected by when the water vapour rises it forms together to make clouds which is also part of the water cycle.

Evaporation and Condensation are connected because (evaporation) the water evaporates and rises and it clumps together to make clouds (condensation).

Condensation and Hurricanes are connected because they both form.

Hurricanes and Climate Change is connected because Hurricanes can change the climate and the surface of the Earth which can lead to disrupting weather patterns.

Water Vapour and Precipitation are connected because water vapour goes up into the clouds


Thursday, October 17, 2019

Wind Power

Definitions:

  1. Anemometer:
  2. Beaufort wind scale:

Anemometer

MATERIALS

  1. Skewers  
  2. Vivid  
  3. Tape  
  4. Pencil
  5. Pin  
  6. Plastic lid thing

STEPS

  1. Gather all the materials.
  2. Tape the plastic lids to each side of the skewers.
  3. Tape the skewers together.
  4. Then, place the skewers onto the eraser.
  5.  Put the pin through the skewers and eraser.

Group Investigation.

Groups size: 5 
Roles:

  • Timekeeper ( watch)
  • Counter
  • Recorder ( Chromebook or refill )
  • Anemometer Manager ( Anemometer)
  • Wind Manager

Instructions:
  • Go to the measuring place and set up your wind gauge.
  • Make sure everyone in your group is ready to start their roles.
  • Record how many times it spins and record it in the table below.
  • Count the number of spins in 15 seconds.
  • Record it on your chart.

FINDINGS


Place name on school grounds                                    Number of Spins in 15 seconds
1.Field0
2.Old J Block site0
3.Grass hill in quad0
4.Tennis Court gate0

CONCLUSION:

I think that there was no wind on the field because most of the people in our group were crowding around the wind gauge.

I think there was no wind at the olf j block site because there was a building right next to it making it so there was less wind.

I think that there was no wind on the grass hill because it was surrounded by buildings with not a lot of gaps, even though it was higher up, I think the buildings were blocking some of the wind, as well as some of the people in our group crowding it.

I think that there were trees around it as well as people crowding it and a fence.